Having all of these words in a sentence can be confusing sometimes but don’t fret, we’re here to clarify that!
Transpose, Pivot, and Unpivot are amazing transformation techniques used in data analysis and reporting. They help make the analysis easier and simpler to follow through.
Now, let us look at each of these techniques one after the other:
Transpose
In the simplest form, to transpose means to flip a table such that the rows become columns and columns become rows. This is helpful when you want to rearrange the way data is displayed or if you need to perform calculations on data that isn’t organized the way you need it.
For example, suppose we have the following table of data:

If we transpose this table, the rows become columns and the columns become rows:

Notice that, the rows and columns have been reversed, and each row now denotes a product and each column a year.
Pivot
In general, to pivot means to turn or rotate around a central point. In Power Query, “Pivot” is a transformation step that allows you to transform a table by rotating its columns into rows or rows into columns, and aggregating the data based on the values in those columns.
Suppose we have a table of sales data that looks like this:

We want to create a pivot table that shows the total sales for each product, grouped by region.
The resulting pivot table will look like this:

Observe how the columns have been transformed into rows and the rows into columns. Based on the chosen grouping and value columns, the values in the “Sales” column have been aggregated. The final pivot table displays the total sales for each product, broken down by region.
Pivot and transpose are both ways to rotate tables, but they do it in different ways. Pivot turns the table sideways and combines data, while transpose just flips the table sideways without changing the data.
Unpivot
Unpivoting is the process of transforming column-based data into row-based data. This is the opposite of the Pivot transformation we discussed earlier.
Here’s an example of how to use the Unpivot transformation in Power Query with a sample dataset:
Suppose you have a dataset that looks like this:

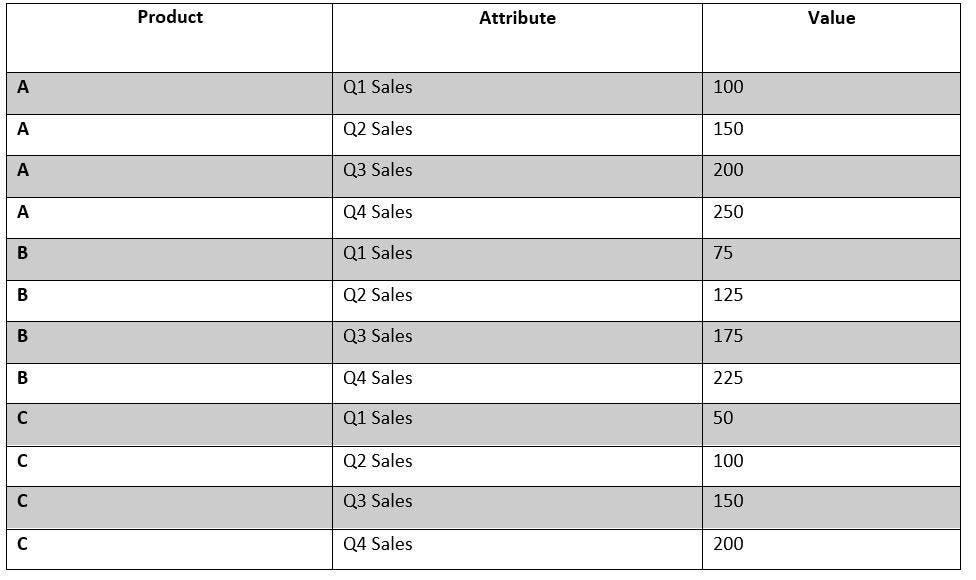
After Unpivoting, the resulting table should look like this:

As you can see, the Unpivot transformation changed the data’s format from one that was based on columns to one that was based on rows. Now the quarter information is in the “Attribute” column, and the corresponding sales amounts are in the “Value” column. This table can now be used to examine sales information by product and quarter.
Conclusion
Try it out for yourself: If you’re new to transpose, pivot, and unpivot in Power Query, try using these tools with your data to see how they work. You might be surprised at how much easier it is to analyze your data once you know how to use these tools effectively.
About the Author
You can connect with Faith Oseghale to me on Twitter or LinkedIn
